

0 item(s)
View cart
You have no items in your shopping cart.
Last Updated: September 9, 2026
Organizations using a unified security platform achieve an average ROI of 101%, compared to just 28% for those operating with fragmented toolsets, a 3.6x performance gap documented by IBM Institute for Business Value 2026 analysis. That single statistic should reshape how security directors justify consolidation projects to their CFOs. This unified security platform ROI analysis from IMRON Corporation examines the hard numbers behind platformization, the cost categories that drive returns, and the hidden expenses most business cases ignore.
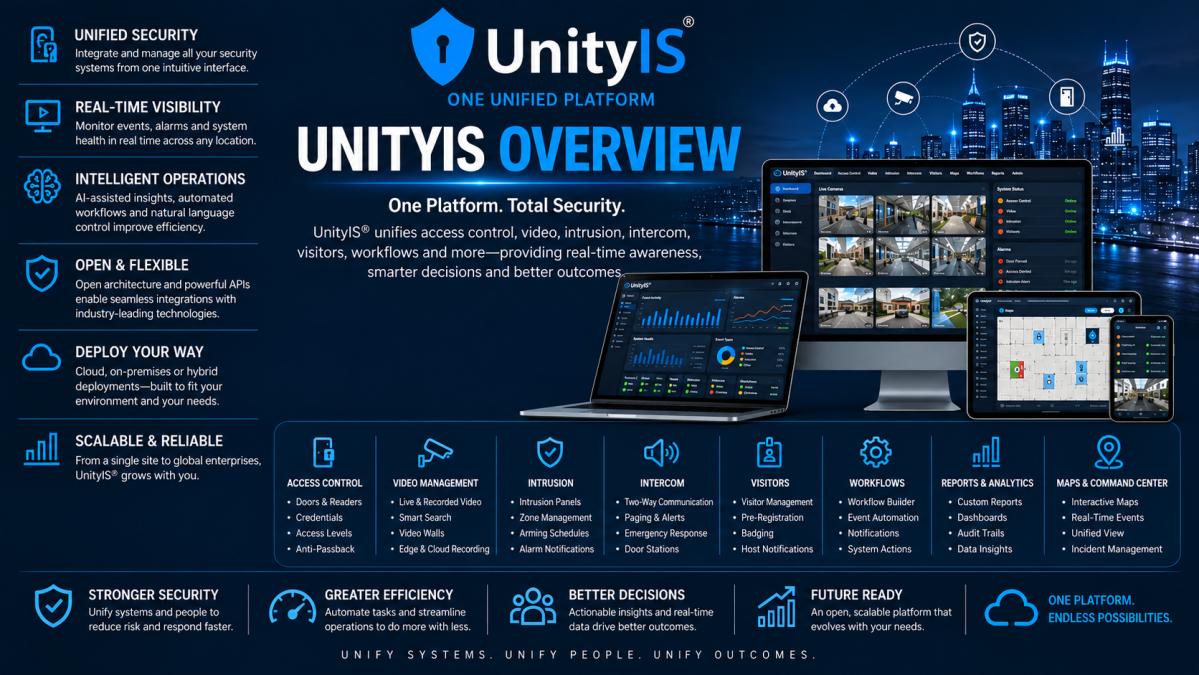
A unified security platform is a single software foundation that manages access control, video surveillance, intrusion detection, and related security functions from one interface rather than forcing operators to jump between disconnected systems.
The decision requires more than a headline ROI figure. Below, we break down the 2026 data, provide a practical TCO calculator framework, and show where the real savings accumulate over a three-year horizon.
The 2026 research is remarkably consistent: consolidation pays, and it pays quickly. A Forrester Consulting TEI study for JFrog Security found that organizations deploying a unified platform for security management realized a 282% ROI with a net present value of $4.0 million and a payback period under six months.

The gap is structural. Organizations running siloed security tools average 28% ROI, while those on unified platforms report 101%. Platformization delivers a 3.6x higher return because it eliminates redundant infrastructure, reduces vendor management overhead, and lets security teams work from a single source of truth.
The payback timeline surprises most budget holders. CrowdStrike's three-year ROI analysis shows the Falcon platform achieved up to 441% ROI with full payback within four months, including an 86% reduction in false positives. Similarly, IDC research on Chronicle Security Operations documented a 407% ROI over three years with a payback period under seven months. When the payback window is measured in months rather than years, the capital approval conversation changes entirely.
Building a credible business case means moving beyond aggregate ROI percentages to model your own environment. A unified security platform TCO calculator should capture both direct cost reductions and the operational savings that quietly accumulate.
Cost Category |
Fragmented Approach |
Unified Platform |
Annual Savings |
|---|---|---|---|
Licensing & maintenance |
Multiple vendor contracts |
Single platform license |
20-35% |
Hardware infrastructure |
Duplicate servers, gateways |
Consolidated footprint |
15-25% |
Security administration |
3-5 separate interfaces |
One management console |
30-40% |
Training & onboarding |
Per-system certification |
One platform curriculum |
25-45% |
Fragmented deployments carry multiple licensing streams, separate maintenance agreements, and hardware that often duplicates functions across systems. Consolidating to a single platform eliminates overlapping contracts and reduces the physical infrastructure required to run security operations.
The larger savings hide in operational overhead. Security staff managing three separate systems spend meaningful time switching contexts, reconciling alerts, and maintaining expertise across each platform. A unified approach cuts that overhead substantially, and the NetWitness performance analysis confirms the operational impact: unified platforms resolve security issues 72 days faster on average and contain incidents 84 days sooner than fragmented environments.
When doors, cameras, and alarms share a common platform, events become correlated automatically. A door forced open triggers video verification without an operator manually toggling between systems.
Response times compress dramatically when video and access events live in the same interface. Investigators can replay an incident timeline, pull access records, and review footage without exporting data between systems. What took hours of manual correlation now takes minutes, and the Forrester Total Economic Impact study on Microsoft Security found that unified customers reduced their likelihood of a security breach by up to 30%.
Each alert demands triage, whether legitimate or not. The CrowdStrike data showing an 86% reduction in false positives illustrates what happens when correlated context replaces raw alert streams: analysts spend their time on genuine threats rather than chasing noise.
Security system consolidation ROI extends well beyond license savings. The operational efficiency gains from unifying access control, video, and building systems create compounding value that grows with every integration.
TAG Analysts' 2026 ROI analysis of the Orca platform documented a 198% ROI for unified cloud security users, driven largely by analyst productivity gains. When your team stops re-entering data, cross-referencing timestamps, and maintaining parallel records, those hours return to actual security work. Organizations on unified platforms report a 44% improvement in operational efficiency, a figure that translates directly into either faster response times or a smaller headcount requirement.
A camera records an event, an access log captures an entry, but no single system connects them. Unified platforms eliminate those gaps by correlating telemetry across physical and logical security boundaries, shortening detection time and improving overall security posture.
The ROI figures above assume successful implementation. The migration itself carries costs that many business cases underestimate, and glossing over them is the fastest way to lose credibility with a CFO who has lived through a failed consolidation.
1. Parallel Operations Overlap
Most migrations require a 3-6 month overlap where you pay for both the legacy systems and the new platform. For a mid-sized enterprise with 50 sites, this dual-payment period can consume 15-20% of the total first-year budget. The mitigation is staging: migrate one region or building cluster at a time.
2. Data Migration and Normalization
Data schemas differ, timestamps need reconciliation across time zones, and legacy video formats may require transcoding. Organizations typically underestimate this effort by 2-3x. A practical approach is to migrate only the last 12-18 months of active data and archive the rest to cold storage for compliance retrieval.
3. Integration Engineering
Door controllers from one vendor, cameras from another, and an intrusion panel from a third all need integration layers. The hidden cost is not just the middleware licenses but the engineering hours to test and validate each integration path. Open-architecture platforms reduce this burden by supporting standard protocols like ONVIF for cameras and OSDP for access control readers, but custom edge cases still require hands-on work.
4. Productivity Dip During Transition
The learning curve typically spans 4-8 weeks, during which response times slow and false positives spike as staff adjust to new alert workflows. This productivity dip is rarely quantified in ROI models, yet it directly offsets first-quarter gains. The mitigation is scheduling training before go-live and running a shadow period for non-critical tasks.
A rip-and-replace strategy for a 100-door, 200-camera deployment can run $250,000-$500,000 in hardware alone before installation and configuration costs. A phased integration approach preserves that infrastructure investment and spreads the migration cost across 12-18 months.
A fully greenfield deployment lets you standardize on one hardware ecosystem, simplifying long-term maintenance. A hybrid approach keeps legacy gear in place but may require ongoing support for older firmware versions. Most practitioners find the hybrid approach delivers 70-80% of the ROI benefit at 40-50% of the upfront cost.
The organizations that succeed budget a 20-25% contingency buffer on top of their migration cost estimate. That buffer is the difference between a stalled project and one that delivers the promised ROI on schedule.
A realistic migration budget for a multi-site enterprise should allocate roughly 30% to integration engineering, 25% to parallel operations, 20% to training and productivity dip, 15% to data migration, and 10% to contingency. When you build the business case with these line items visible, the CFO sees a credible plan rather than an optimistic headline number.
Not every organization captures the same return from platform consolidation. The industries with the highest ROI share common traits: multiple sites, diverse security systems, and regulatory compliance obligations.
Healthcare organizations integrating physical security with cybersecurity protocols see strong returns because compliance overhead drops. Educational campuses managing access control across dozens of buildings eliminate per-site management overhead. Critical infrastructure facilities reduce risk exposure by correlating physical and logical security events. Multi-site enterprises benefit most from centralized monitoring.
Organizations with more sites, more systems, and more compliance requirements generate more consolidation value. Single-site operations will see modest returns, while enterprises managing hundreds of doors across multiple states capture the full ROI potential.
Most published analyses stop at year three because that is where the vendor-sponsored studies end. A C-suite decision maker approving a 5-7 year platform commitment needs a longer view of the full lifecycle cost profile.
Unified platforms typically deliver lower ongoing costs than fragmented stacks, but the savings profile changes over time. The pattern follows a predictable arc:
The 5-year total cost of ownership is typically 15-25% lower than the 3-year projection would suggest, because the initial migration investment gets amortized over a longer productive period. This only holds if the vendor maintains backward compatibility and does not force disruptive major version upgrades.
Three factors dominate the long-term maintenance curve:
Vendor renewal escalations. Most platform licenses include 15-20% annual maintenance fees based on the original license value. At year five, cumulative maintenance payments can exceed the initial license cost. Negotiating a multi-year maintenance cap at the time of initial purchase is the single most effective way to control 5-year costs.
Hardware refresh cycles. Cameras have a 5-7 year lifespan, door controllers 7-10 years, and servers 3-5 years. A unified platform does not eliminate hardware refresh costs; it consolidates them into predictable cycles rather than staggered, unpredictable replacements across multiple systems. Budgeting 8-12% of the original hardware value annually for refresh is a realistic planning figure.
Staff turnover and training. Every operator or administrator departure creates a training gap. With a fragmented stack, each new hire needs certification on 3-5 separate systems. With a unified platform, the onboarding curve is shorter and the training cost per hire is 40-60% lower. Over a 5-year period with typical turnover rates, this compounds into meaningful savings.
When the platform integrates with leading access control hardware and cameras, you can switch components without rebuilding the entire system. A vendor knows you can walk away from a component-level disagreement without a rip-and-replace, which keeps renewal pricing competitive.
At year five, the cost of switching platforms is high enough that the incumbent vendor holds significant leverage. The result is often 10-20% renewal increases that erode the long-term ROI case.
A healthcare system with 20 facilities, a university with 100 buildings, or a logistics operator with 50 distribution centers all face procurement cycles that extend beyond a 3-year vendor study. For these organizations, the decision is not whether to consolidate but which platform will still be cost-effective at year seven.
Treating the migration as a single-year expense rather than a multi-year investment is the most common business case error. Spread implementation costs across the full ROI horizon, and the total return compounds. Organizations that model the full lifecycle consistently find that unified platforms deliver 1.5-2x the cumulative savings of fragmented alternatives by year five.
Calculate ROI by comparing total costs (licensing, hardware, integration, training, and maintenance) against quantifiable gains. These gains include reduced administration time, faster incident response, fewer false positives, and lower licensing costs from vendor consolidation. In 2026 studies, unified platforms delivered an average ROI of 101%, versus 28% for fragmented toolsets. Use a payback period calculation to determine when cumulative savings exceed your initial investment. Most organizations see payback in under six to seven months.
The primary savings come from eliminating duplicate infrastructure, reducing vendor management overhead, and cutting training time on multiple interfaces. Organizations also save through fewer false positives, which reduces analyst workload. Unified platforms can lead to a significant reduction in false positives and an improvement in operational efficiency. Unified platforms also lower total cost of ownership by reducing the integration costs between separate systems.
Both physical and IT security consolidation show strong returns, but the drivers differ. Physical security consolidation, such as integrating access control and video management, primarily saves through reduced operator workload and faster investigations. IT security consolidation saves through improved threat detection and faster containment. NetWitness data shows unified platforms resolve issues 72 days faster. A unified physical security platform like UnityIS delivers similar operational gains for facility teams managing multi-site deployments.
Include direct metrics like licensing costs, hardware replacement costs, and maintenance fees. Add operational metrics such as time spent on security administration, false positive rates, and mean time to respond to incidents. Studies have shown that unified platforms can lead to a reduction in security incident likelihood. Include a payback period calculation and net present value (NPV) to capture the full financial picture. Do not ignore soft costs like security analyst training time.
 IMRON Corporation